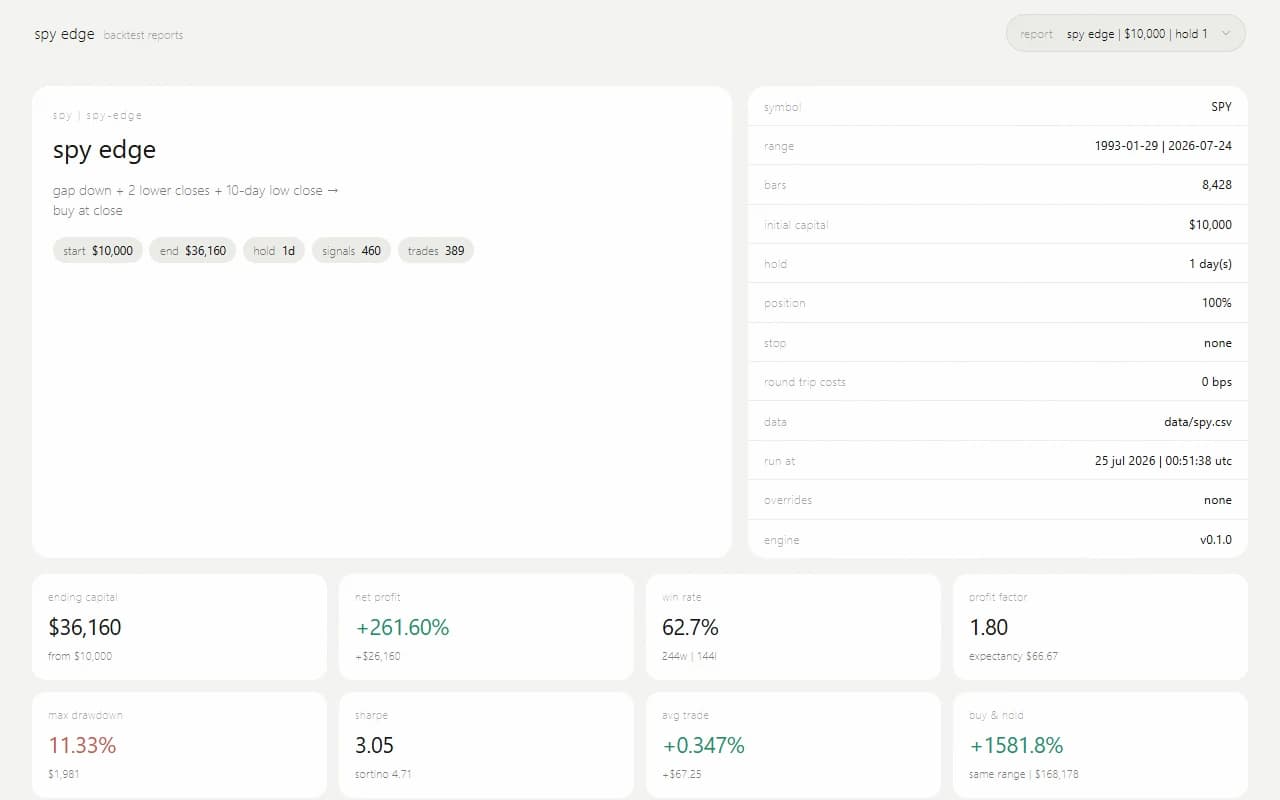
spy edge
2026personal quant research, built end to end. a rust backtesting engine, a parallel parameter optimizer, and a report site for one daily spy mean reversion edge, stress tested with sizing, trend filters, stops, costs, and walk forward validation.
not financial advice
everything on this page is personal research and an engineering write up. it is not financial advice, not a recommendation to buy or sell anything, and not a claim that any strategy will make money. backtests study the past. the future is under no obligation to cooperate.
- role
- research & engineering
- stack
- rust
- html
- css
overview
spy edge is personal research: a backtesting engine written in rust, a parameter optimizer that sweeps hundreds of rule combinations in parallel, and a small report site that turns every saved run into an interactive page with equity curves, drawdown charts, and full trade tables.
the subject is one daily mean reversion signal on spy, the s&p 500 etf. the question is simple. a published edge looks great in a screenshot. does it survive clean data, honest simulation, transaction costs, and validation on years it has never seen?
the deliverable is not the strategy. it is the process. this page walks through the whole build, shows the public starting rules, and reports what happened along the way, including the unflattering parts.
where it started
i kept seeing the same short rule set float around: gap down, a couple of lower closes, a fresh ten day low. buy the panic, sell the bounce. the charts looked clean. the captions were short. the claims were big.
screenshots are not evidence. so i rebuilt the whole thing from zero: my own data pipeline, my own engine, my own numbers. if the edge is real it should survive my code too.
how the codebase is structured
a rust workspace with two crates, a dependency free frontend, and a data folder that acts as the single source of truth. every run ever executed is archived with its full settings, so any number on this page can be traced back to an exact command.
the data
first lesson: free market data is hostile. stooq now sits behind a javascript challenge, so a plain http client gets a browser check instead of csv. yahoo's chart api still answers without a key, but with a trap. asking for the maximum range quietly downsamples to monthly bars. full daily history needs explicit period bounds.
the final snapshot is 8,428 daily bars of spy, january 1993 through july 2026, validated and saved as a local csv. the engine never touches the network. every backtest runs against the same frozen file, so results are reproducible to the cent.
the engine
the backtest crate scans the candles for signal days, then simulates a sequential strategy: one position at a time, buy at the close, hold for a configurable number of days, compound the proceeds. signals that fire mid trade are skipped. no "bet every signal in parallel" fantasy.
each run produces a full report: net profit, profit factor, win rate, average and largest wins and losses, expectancy, max and average drawdown, recovery factor, sharpe and sortino, a buy & hold benchmark, an independent forward return table per holding period, monthly and yearly p&l, the complete equity curve, and every trade. the execution layer also supports fractional position sizing, protective stops, and per trade costs.
nothing is overwritten. every run gets a unique id with its timestamp, strategy, capital, and hold baked in, plus a meta block recording the exact command and settings that produced it.
the starting strategy
the baseline rules are public knowledge, so here they are exactly as they look in the engine. three conditions at the close: spy gapped down, closed lower two days in a row, and printed its lowest close of the last ten sessions. buy the close, exit the next close. panic, statistically, has a bounce.
/// the published spy edge | gap down + 2 lower closes + 10-day low.
/// this is the public starting point, not the optimized system.
pub struct SpyEdge {
    pub lower_closes: usize, // published: 2
    pub low_window: usize,   // published: 10
}

impl Strategy for SpyEdge {
    /// all three checks use the daily close, nothing intraday.
    fn is_entry(&self, candles: &[Candle], i: usize) -> bool {
        let warmup = self.low_window.max(self.lower_closes + 1);
        if i + 1 < warmup {
            return false;
        }

        let c = &candles[i];

        // 1. gap down | today opened below yesterday's close
        let gap_down = c.open < candles[i - 1].close;

        // 2. n consecutive lower closes
        let lower_chain = (0..self.lower_closes)
            .all(|k| candles[i - k].close < candles[i - k - 1].close);

        // 3. today's close is the lowest of the last m sessions
        let start = i + 1 - self.low_window;
        let window_low = candles[start..=i]
            .iter()
            .all(|bar| c.close <= bar.close);

        gap_down && lower_chain && window_low
    }

    /// buy at the close, exit at the next close.
    fn default_hold(&self) -> usize {
        1
    }
}
every strategy in the project implements this same trait, exposes its tunable parameters to the optimizer, and plugs into the same engine. a new variant is one small file, not a fork.
the report site
numbers in a terminal do not convince anyone, so the project has its own report viewer: a single light page with a custom dropdown of every archived run, kpi tiles, an equity curve with a smart positioned tooltip, drawdown and monthly charts, forward return tables, and the full trade list.
it is deliberately dependency free. vanilla javascript and hand drawn svg, no chart library, served by a node script that is itself a few dozen lines. the whole frontend survives being opened from a file share in ten years.
the optimizer
the published parameters are just numbers someone else chose, so the next move was to stop guessing. each parameter gets an inclusive range and a step, the optimizer builds the cartesian product of all of them, and backtests every combination in parallel across all cpu cores. the first sweep was 640 full backtests over 33 years of data.
trials are ranked by one objective: net profit percent divided by max drawdown percent. that single number pushes both things that matter, return up and drawdown down, and trials with too few trades never outrank qualified ones, because twelve lucky trades are not a strategy. sweeps live in their own quarantined folder. only a deliberately promoted best lands in the main archive.
five risk experiments
a tuned backtest is where most write ups stop and where the interesting questions start. so the tuned rules went through five separate experiments, each one isolated as its own strategy variant with its own sweep, all at $100,000 starting capital with profits reinvested.
fractional sizing tested whether risking only part of the account improves the return to drawdown ratio. it did not. full allocation won under this objective. a long moving average trend filter tested whether skipping bear market signals helps. it did. the only experiment that improved return and drawdown at the same time. a protective stop tested whether cutting losers early saves the curve. it did not. the optimizer chose the loosest stop allowed and tripled the drawdown. fixed round trip costs tested whether friction erases the edge. it trims it, meaningfully, but the edge survives. and walk forward validation (tune on the first 70% of history, freeze, report only the untouched last 30%) tested whether any of this is real out of sample.
the numbers
all figures are simulated returns over the full 1993 to 2026 history unless noted, from the archived reports. buy & hold over the same span did +1,581%, but spent most of those years fully invested, while this system is in the market only a few days at a time.
published rules, as found
+261.6%
max drawdown 11.3%
optimized rules
+758.6%
max drawdown 12.54%
optimized + trend filter
+848.8%
max drawdown 10.87%
optimized + protective stop
+1,434.5%
max drawdown 32.31%
optimized + 5 bps friction
+674.2%
max drawdown 12.59%
walk forward, out of sample
+69.7%
max drawdown 12.54%
one optimized run
below is the equity curve and drawdown from the optimized run that added a long moving average trend filter. same report layout as the project site, just static here. parameters stay private.
optimized + trend filter
$100,000 to $948,845
+848.85%
equity curve
drawdown
why the best parameters are not here
the starting rules are public and shown above. the exact windows, holds, and filter settings behind the optimized runs are not. this page shares the process and the honest results, not the tuned system. partly because it is mine, and partly because a parameter set stripped of its validation context is exactly the kind of screenshot this project was built to question.
what i learned
in sample optimization always flatters. the +848% curve is real arithmetic on real data, but it was selected by hindsight. the +69.7% out of sample number is the one that carries decision weight, and it is an order of magnitude humbler.
robustness lives in the neighbours. the encouraging sign in the sweep was not the single best trial. it was that the parameter values around it scored almost as well. a sharp, isolated peak in a results table is a fitting artifact, not an edge.
intuitive risk tools are not automatically good ones. the protective stop, the most obvious "safety" feature, made risk dramatically worse here, while the boring trend filter quietly improved both sides. and modest, realistic costs are survivable, which is worth knowing before anything else matters.
disclaimer
The information on this page is provided for general portfolio and informational purposes only. No representation or warranty is made as to its accuracy, completeness, currency, or correctness, and no reliance should be placed on it as advice or as a statement of fact. All content is offered without guarantee and may be updated or corrected at any time without notice.